Situation on the electricity market
Production of electricity
Pursuant to the data published by Polskie Sieci Energetyczne the domestic production of electricity in 2015 amounted to 161,772 GWh.
Domestic production of electricity - annually in 2006-2015 [GWh]

Domestic consumption of electricity - quarterly in 2014-2015 [GWh]

Electricity generation structure in Polish power plants [GWh]
| Types of power plants | 2006 | 2007 | 2008 | 2009 | 2010 | 2011 | 2012 | 2013 | 2014 | 2015 |
|---|---|---|---|---|---|---|---|---|---|---|
| Commercial on bituminous coal | 92 111 | 93 133 | 86 550 | 84 274 | 89 212 | 90 811 | 84 492 | 84 566 | 80 284 | 81 883 |
| Commercial on brown coal | 53 518 | 51 142 | 53 798 | 50 797 | 49 459 | 53 623 | 55 592 | 56 959 | 54 212 | 53 564 |
| Industrial | 8 280 | 8 216 | 8 045 | 8 204 | 8 923 | 9 000 | 8 991 | 9 171 | 9 020 | 9 757 |
| Gaseous | 4 046 | 3 908 | 3 988 | 4 052 | 4 166 | 4 355 | 4 485 | 3 149 | 3 274 | 4 193 |
| Commercial hydroelectric | 2 822 | 2 682 | 2 516 | 2 751 | 3 268 | 2 529 | 2 264 | 2 762 | 2 520 | 2 261 |
| Wind | 69 | 436 | 672 | 821 | 1 300 | 2 798 | 3 954 | 5 823 | 7 184 | 10 041 |
| Other renewable | 1 | 10 | 8 | 14 | 11 | 35 | 71 | 72 | 73 | 73 |
Domestic consumption of electricity
Pursuant to the data published by Polskie Sieci Elektroenergetyczne the domestic consumption of electricity in 2015 was higher by 1.7% than in 2014.
Domestic consumption of electricity - annually in 2006-2015 [GWh]

Domestic consumption of electricity - quarterly in 2014-2015 [GWh]

Source: http://www.pse.pl/index.php?modul=8&id_rap=212
Intersystemic exchange
In 2015 a positive balance of intersystemic exchange was developed as a result of a surplus of energy exported abroad over the energy imported in the amount of 330 GWh. For comparison, in 2014 the balance of intersystemic exchange of electricity amounted to (-) 2,167 GWh.
Exchange of electricity with abroad - annually in 2006-2015 [GWh]

Exchange of electricity with abroad - quarterly in 2014-2015 [GWh]

Wholesale electricity prices
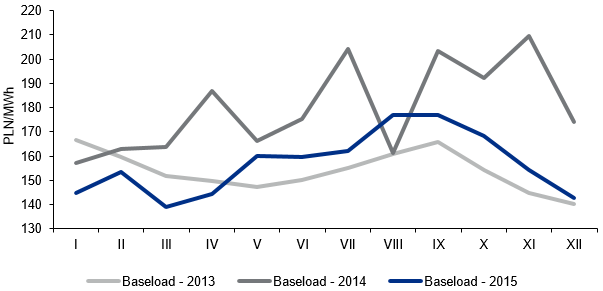
In 2015, after growths in 2014, a drop in prices was reported yoy on spot market (Table 1). Low prices were affected e.g. by the following factors:
- high level of wind generation
- high level of forward market participants contracting
- relatively high level of power available for OTSs
- relatively mild atmospheric conditions during winter (“warm winter”)
However, what affected the relatively high price levels in August and September, compared to the other months of the year, was: high demand, heat, difficult hydrological situation and losses of power available to OTSs.
Average prices on SPOT market (PPE)
| Period | Average price [PLN/MWh] | Change [%] |
|---|---|---|
| 2013 | 153.82 | 11.4 |
| 2014 | 179.86 | 16.9 |
| 2015 | 156.95 | 12.7 |
Average level of prices in baseload on SPOT market (DAM)
A drop in electricity prices, supported with fundamental factors, was observable also on the forward market. From the beginning until the end of 2015 the price of the most liquid product, BASE Y-16 dropped from 181.00 PLN/MWh to 167.50 PLN/MWh. What affected the growths in the last quarter of 2015 was information on the planned changes in the Operating Capacity Reserve (increasing the OCR budget, growth in the reference price of the hourly operating capacity reserve, introduction if complementary settlements). Finally, BASE Y-16 closed with the price on the level by 9.50 PLN/MWh lower than for BASE Y-15.
| Product | Price at the end of quotations | Change yoy | Average pricefrom quotations | Change yoy |
|---|---|---|---|---|
| [PLN/MWh] | [%] | [PLN/MWh] | [%] | |
| BASE Y-14 | 151.00 | 10.9 | 160.27 | 16.2 |
| BASE Y-15 | 177.00 | 17.2 | 168.13 | 4.9 |
| BASE Y-16 | 167.50 | 5.4 | 166.49 | 1.0 |
Source: own development based on data from PPE, TFS and WSEInfoEngine
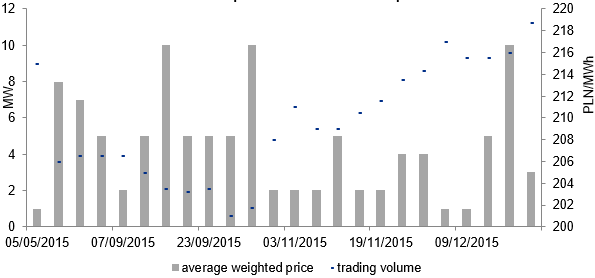
Transaction prices and volumes - baseload for 2016
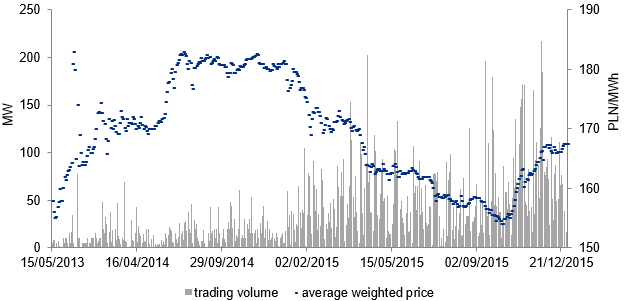
In 2015, a similar level of market participants’ activity was observed on the most popular forward product. Comparing the total volume of trading in annual contracts in the whole period of their quotation the volume grew by ca. 1.5% (the total turnover on BASE Y-16 amounted to 16,758 MW, and on BASE Y-15 16,507 MW).
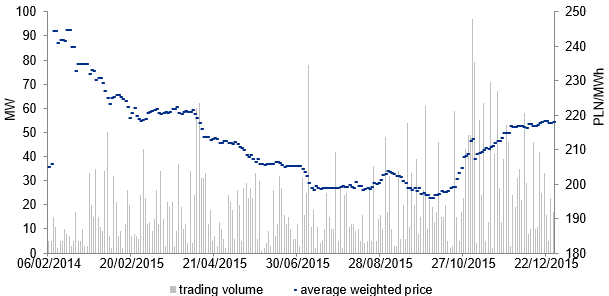
PEAK Y-16 behaved like BASE Y-16 and its price decreased at the beginning of 2015, after which from October of the year grew regularly until the end of the year. The last transaction was concluded at 218.25 PLN/MWh (however by 15.70 PLN/MWh less than the last transaction for PEAK Y-15).
Transaction prices and volumes - PEAK Y-16
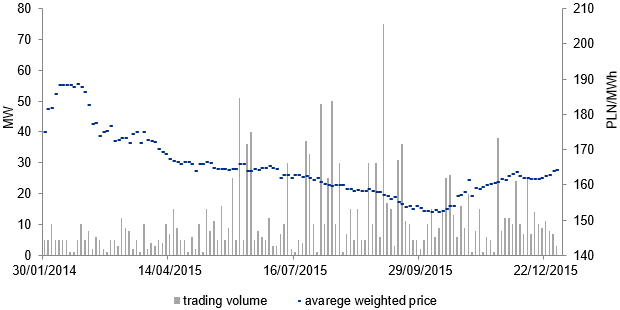
The prices of BASE Y-17 were similar to BASE Y-16 prices. After a stage of decreases lasting until Q3 2015, the contract price in Q4 2015 began to grow to the level of 164.25 PLN/MWh. At the end of the year the spread between BASE Y-17 and BASE Y-16 amounted to -3.25 PLN/MWh (counting from the last transactions), which means that 2017 was valued lower than 2016.
In 2015 transactions were also concluded for PEAK-17 and BASE Y-18 products, however because of a remote delivery horizon the trade volume was low.
In 2015 the prices of electricity returned to the downward trend.
The factors which favoured price declines were:
- coal surpluses on fuel market reflected in low coal prices
- high level of power connected with planned significant growth in installed capacity in wind power plants in Poland
- planned growth in possibilities of importing energy to Poland in conjunction with considerably lower energy prices on foreign markets
Only the works on the changes in OCR mechanism prevented further drops and resulted in the growth in prices at the end of 2015. The works over potential introduction of the capacity market mechanisms or changes in the current rules of remunerating for OCR will have a great importance for the further shaping of the market situation.
Transaction prices and volumes - baseload for 2017
Transaction prices and volumes - euro-peak for 2017
Obligations with respect to obtaining energy certificates of origin
In accordance with the regulations being in force energy companies selling electricity to end users in 2015 were obliged to obtain and redeem the following types of certificates of origin:
- for energy generated in renewable sources, the so called "green" certificates - the obligation on the level of 14.0% of sales to end users
- for energy generated in methane-fired cogeneration, the so called "violet" certificates - the obligation on the level of 1.3% of sales to end users
- for energy generated in gaseous cogeneration units or units with the total installed capacity up to 1 MW, the so called "yellow" certificates - the obligation on the level of 4.9%
- for energy generated in other cogeneration sources, the so called "red" certificates - the obligation on the level of 23.2%
- energy efficiency certificates, the so-called "white" certificates
During the last days of 2015, there were significant changes in the legal provisions relating to the market of certificates of origin. The most important factors include:
- prolongation of the validity of energy efficiency act provisions with a year
- Delaying the entry into force of Section IV of the RES Act, covering the new system of support, with 6 months, and therefore prolongation of the period of “introducing” new installations into the system of green certificates
- limitation as of 1 January 2016 of the support for the multi-fuel firing technology
- elimination as of 1 January 2016 of the support for hydroelectric power plants with the installed capacity over 5 MW
The contracting price structure on the PPE's session market for particular proprietary interests in the period until the end of Q4 2015 is presented below. The analysis excludes PMOZE "green" PIs due to lack of trading volumes and their entire replacement with PMOZE_A.
Prices on the certificates of origin market (PPE's session market)
| Average price in 2015 | Change in relation to Q4 2014 | Maximum price | Minimum price | ||
|---|---|---|---|---|---|
| PLN/MWh | % | PLN/MWh | PLN/MWh | PLN/MWh | |
| OZEX_A ("green" proprietary interests) | 123.60 | -24.0% | -39.02 | 163.00 | 99.00 |
| KGMX ("yellow" proprietary interests) | 107.59 | 1.5% | 1.57 | 109.00 | 99.00 |
| 117.35 | - | - | 120.00 | 110.00 | |
| KECX ("red" proprietary interests) | 10.78 | 2.7% | 20.28 | 10.93 | 8.80 |
| 10.68 | - | - | 10.90 | 10.02 | |
| KMETX ("violet" proprietary interests) | 61.84 | 1.3% | 0.81 | 67.00 | 60.00 |
| 61.76 | - | - | 62.30 | 61.02 | |
| EFX ("white" proprietary interests) | 963.44 | 0.7% | 6.26 | 980.00 | 925.00 |
Limits of CO2 emission allowances and their market prices
In 2015, the prices of allowances for emissions of CO2 (EUA), despite the fundamental factors, were affected by the activities realised on the European Union's political scene, including in particular works within:
- market stabilisation reserve (MSR)
- EU ETS structural reform
- climatic declarations before COP21 climate conference
- NOx, SOx and dust emissions reduction
MSR is a mechanism of steering the supply of emission allowances, which as a rule is to translate into the growth in EUA prices via a gradual liquidation of surplus of the units on the market. Higher prices of allowances are to constitute an encouragement for investing in low-emission energy technologies and renewable energy sources. In line with the original version of projected regulations, 12% of the total number of allowances being traded would go to the stabilisation reserve, and the units would be returned to the market when the total number of allowances in n-year were lower than 400 mln.
Although in March 2015 the member states in the negotiating mandate for talks with PE, determined the date of launching MSR for 2021, as a result of further talks (5 May 2015) an agreement was concluded for the planned mechanism launching to be on 1 January 2019.
On 8 July 2015 the European Parliament approved the establishment of the stabilisation reserve in 2018, its launching since 1 January 2019 and allocating to the reserve the emission allowances (900 mln) which were withdrawn from the market in relation to backloading launching (the preliminary date of their return to the market will be in 2019-2020).
On 18 September the ministers of environment of the EU member states adopted a reform of the ETS system, despite the objection of Poland, Croatia, Hungary, Bulgaria, Cyprus and Romania.
COP21 climate conference which took place at the beginning of December 2015 ended with the conclusion of an agreement as regards the shape of the climate policy by 195 states, and through signing individual national commitments by 188 states. Despite a theoretical success of the conference there was a collapse on the market of emission allowances. Individual commitments of the largest issuers (China, USA, India) are not satisfactory, since they will probably not be translated into the real emission reduction during the coming years.
On 29 December 2015 the Polish government agreed to the submission of a complaint for stating invalidity of the decision establishing MSR functioning before 2021, referring to the breach of the e.g. the rule:
- loyal cooperation
- legal reliability
- protection of legitimate expectations
- proportionality
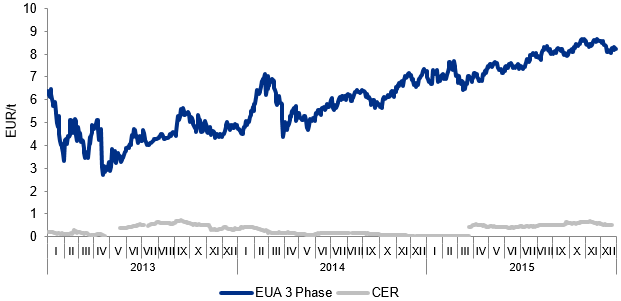
EUA and CER price change
| Product | Price [EUR/t] | Change % | |
|---|---|---|---|
| Beginning ofJanuary 2015 | End of December 2015 | ||
| EUA Spot | 6.99 | 8.22 | 18 |
| CER SPOT | 0.02 | 0.51 | 2 450 |
| EUA Dec-14 | 7.09 | 8.07 | 14 |
| CER Dec-14 | 0.49 | 0.52 | 6 |
Source: Own development based on data from ICE.
Source: Own development based on data from BlueNext and ICE