Key parameters relating to the segment of Distribution
| Description | 2014 | 2015 | Change | Change % | |
|---|---|---|---|---|---|
| Pursuant to the Regulation of the Minister of Economy dated 4 May 2007 regarding detailed conditions of power system operation (HV, MV, LV) | |||||
| SAIDI planned interruptions | 106.09 | 110.19 | 4.10 | 3.9% | |
| SAIDI unplanned interruptions including catastrophic ones | 223.49 | 410.05 | 186.56 | 83.5% | |
| SAIFI planned interruptions | 0.47 | 0.51 | 0.04 | 8.5% | |
| SAIFI unplanned interruptions including catastrophic ones | 3.21 | 5.43 | 2.22 | 69.2% | |
| Pursuant to the methodology adopted by the President of ERO for the needs of the quality tariff (HV, MV) | |||||
| SAIDI planned interruptions | 84.07 | 92.19 | 8.12 | 9.7% | |
| SAIDI unplanned interruptions including catastrophic ones | 194.87 | 341.97 | 147.10 | 75.5% | |
| SAIFI planned interruptions | 0.38 | 0.43 | 0.05 | 13.2% | |
| SAIFI unplanned interruptions including catastrophic ones | 2.99 | 5.07 | 2.08 | 69.6% | |
| RAB [PLN ‘000] | 6 635 665 | 6 910 924 | 275 259 | 4.1% | |
| Grid losses index | 7.2 | 6.9 | -0.3 | -4.2% | |
| Length of lines [thou. km] | 114.6 | 115.6 | 1.0 | 0.9% | |
| Number of power stations [thou. of pieces] | 36.8 | 37.2 | 0.4 | 1.1% | |
| Number of connections [thou. of pieces] | 837.2 | 850.3 | 13.1 | 1.6% | |
| Length of connections [thou. km] | 18.9 | 19.2 | 0.3 | 1.6% | |
In 2015, SAIDI and SAIFI ratios decreased for unplanned interruptions in relation to the same period of the previous year. Higher ratios stem from the catastrophic weather phenomena, which are more express in 2015 than in the previous period. The number of customers deprived of energy was significantly affected by cyclone Felix in January, cyclone Niklas in March, and then in July, August and September - very intense storms with a distant reach.
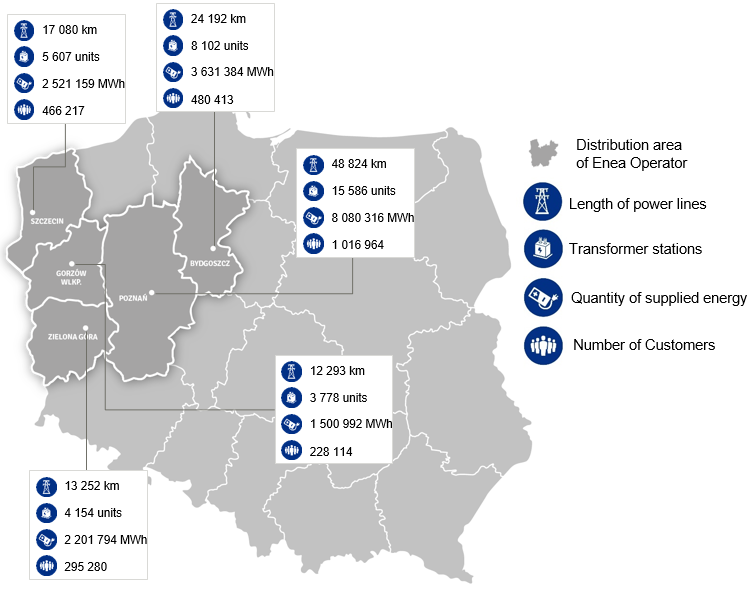
Performing the duties of an operator of the distribution system:
- we maintain, modernise and develop the distribution network, due to which we provide our Customers with energy of higher quality parameters
- we guarantee energy distribution services to all the customers based on an equal treatment
- we introduce solutions increasing the customer access to remote information on connections to the power grid and pursue to shorten the connection completion time
- we develop information tools supporting the grid management
- we increase the level of the grid automation, extend the scope of live works, aiming at the reduction in the length and frequency of interruptions in energy supplies for Customers
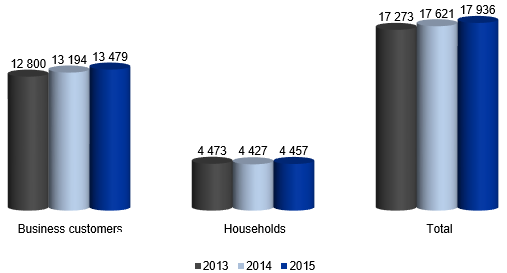
Sales of distribution services in2013-2015 [GWh]
Regulated Income in 2015-2016
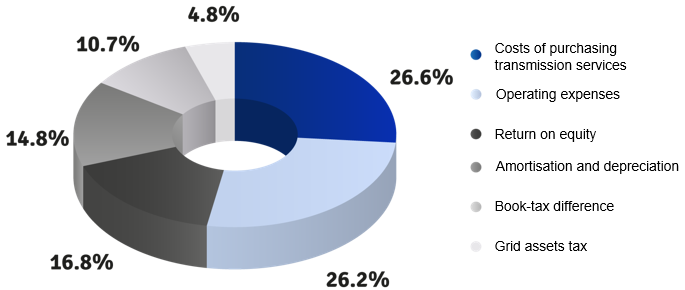
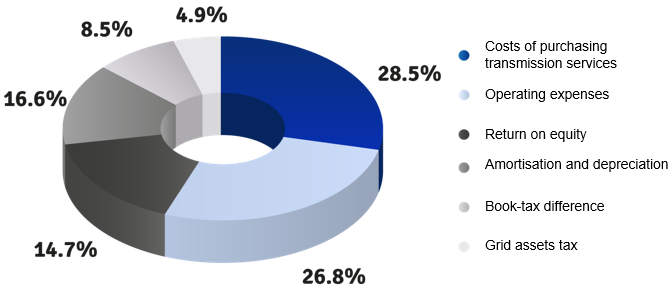
Percentage of particular items in the regulated income in 2015
Percentage of particular items in the regulated income in 2016
- RAB for 2014 tariff year (as at the beginning of a given tariff year) amounted to PLN 6,635,665 thou., WACC - 7.283%
- RAB for 2015 tariff year (as at the beginning of a given tariff year) amounted to PLN 6,910,924 thou., WACC - 7.197%
- RAB for 2016 tariff year (a total of RAB and RAB AMI as at the beginning of a given tariff year) amounted to PLN 7,252,486 thou., WACC - 5.675%
- Costs of purchasing transmission services include also transferred fees (transitory, quality and as of 2016 also RES charge) which constitute, respectively, for 2014: 11.9% of the whole regulated income, for 2015: 13.6% for 2016: 15.86%
- The item of operating expenses includes the value of model operating expenses and out-of-model elements, such as:
- costs of transmission easement
- costs of road use
- fees for perpetual usufruct of land
- fees for permanent exclusion of lands from agricultural or forest production
- costs of fixed assets liquidation
- licence fees
- costs of introducing and collecting RES fees
From January 2016 there was a change in the regulation model for Enea Operator and other ODSs. Differences between the key elements of the current and new model of regulation are presented in the table below:
| Element of regulation | Period of regulation | |||
|---|---|---|---|---|
| 2011-2015 | 2016 | |||
| Model operating expenses |
|
|
||
| Model volume of book-tax difference |
|
|
||
| WACC | WACC 7) determination parameters for 2015: | WACC 7) determination parameters for 2016: | ||
| Risk bonus for foreign capital | 1.00% | Risk bonus for foreign capital | 1.00% | |
| Asset beta | 0.400 | Asset beta | 0.400 | |
| Risk bonus for equity | 4.60% | Risk bonus for equity | 4.20% | |
| Foreign capital | 50.00% | Foreign capital | 50.00% | |
| Formula update for Equity beta calculation | ||||
| Return on capital calculation formula |
|
|
||
| Quality regulation |
|
|
||
1) Efficiency improvement index - sectoral costs
2) Efficiency improvement index - individual costs
3) Improved scales of operations index
4) Efficiency improvement index of book-tax difference for high voltage - sectoral
5) Efficiency improvement index of book-tax difference for medium and low voltage - sectoral
6) Efficiency Improvement index of book-tax difference – individual
7) Weighted average cost of capital
8) Regulatory value of assets